
In the previous guide, you set up Proxmox's own backup system entirely from the panel, namely a scheduled job, a real restore path, and a genuine vzdump run captured start to finish in its own task log. Watching that log by hand only works while someone is actually looking at the screen, so this final guide closes the loop: reading what Proxmox already tracks about its own resources, and turning specific events into a notification somewhere a human actually sees it.
Read the Built-in Resource Graphs
Every node's own Summary page opens on a block of live numbers before a single chart even loads: CPU usage, load average, RAM usage, free disk space, IO delay, KSM sharing, and swap usage, all read directly off the host rather than estimated. The same page also states plainly what hardware and software this platform is actually running on, worth a glance the first time it loads.
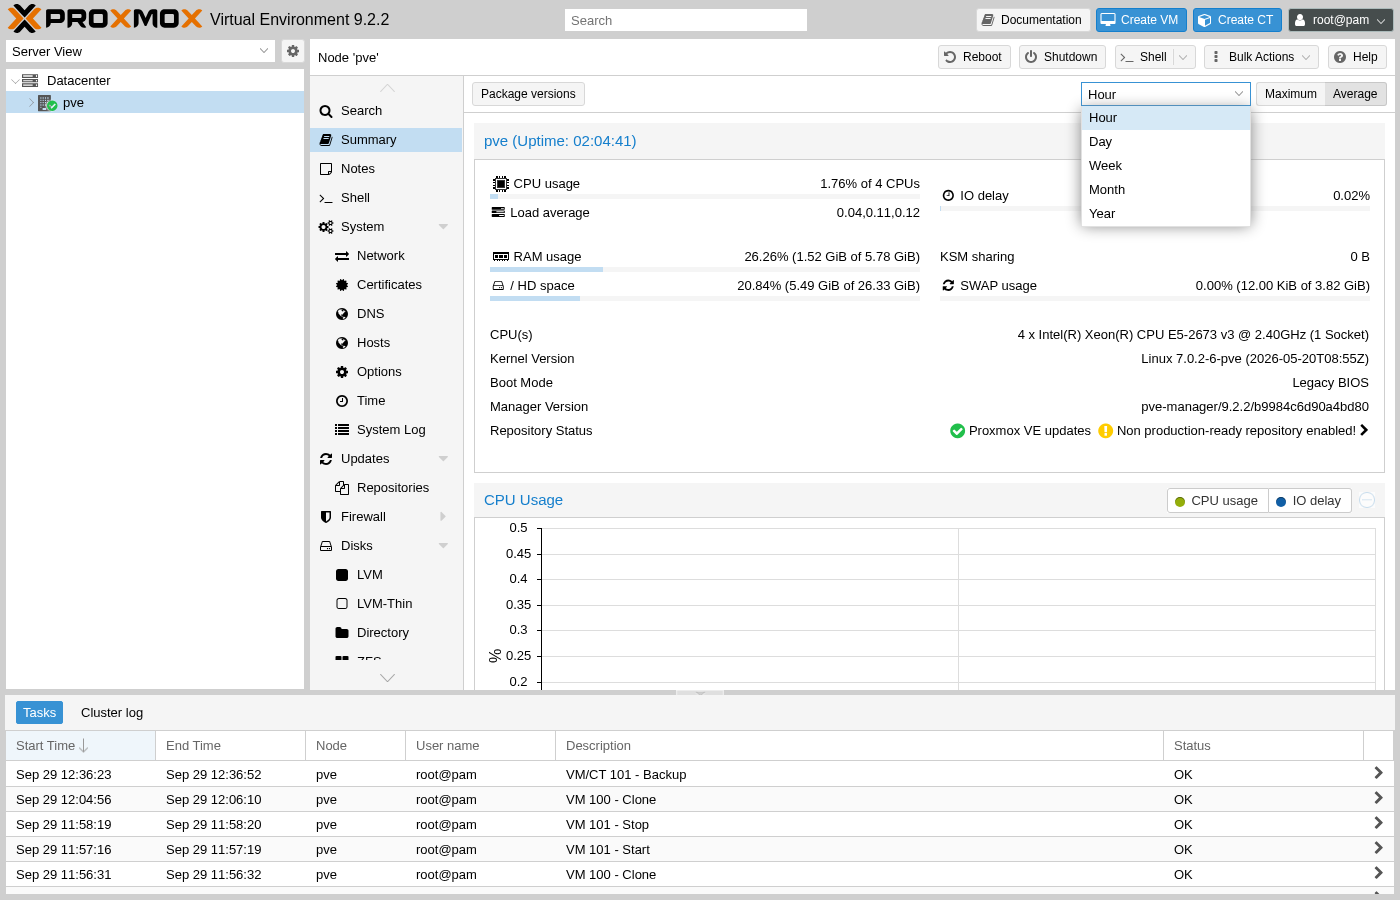
Repository Status is worth reading rather than skipping past: this particular node flags a non production-ready repository, the free no-subscription one this entire lab has run on since the very first guide, a real and correctly surfaced warning rather than a cosmetic nag. Hour, Day, Week, Month, and Year each redraw the same CPU, memory, network, and disk graphs below at a coarser resolution the further back the range reaches, enough to spot a slow memory leak or a disk quietly filling up without reaching for any tool outside the panel itself.
Does that graph history survive a reboot?
Yes. Proxmox stores it as RRD data on disk, the same round-robin format munin and cacti have used for years, so a restart loses nothing already recorded and simply resumes appending to the same file.
Route Real Events to a Real Notification
A graph only helps whoever is actually looking at it, which is why Proxmox ships a separate notification system entirely: Datacenter, Notifications, split into two lists that work together rather than one long settings page.
Look at What's Already Wired Up
A fresh node already has both halves configured, quietly, before anyone touches this page: one target and one matcher, both marked Built-In rather than something a person added.
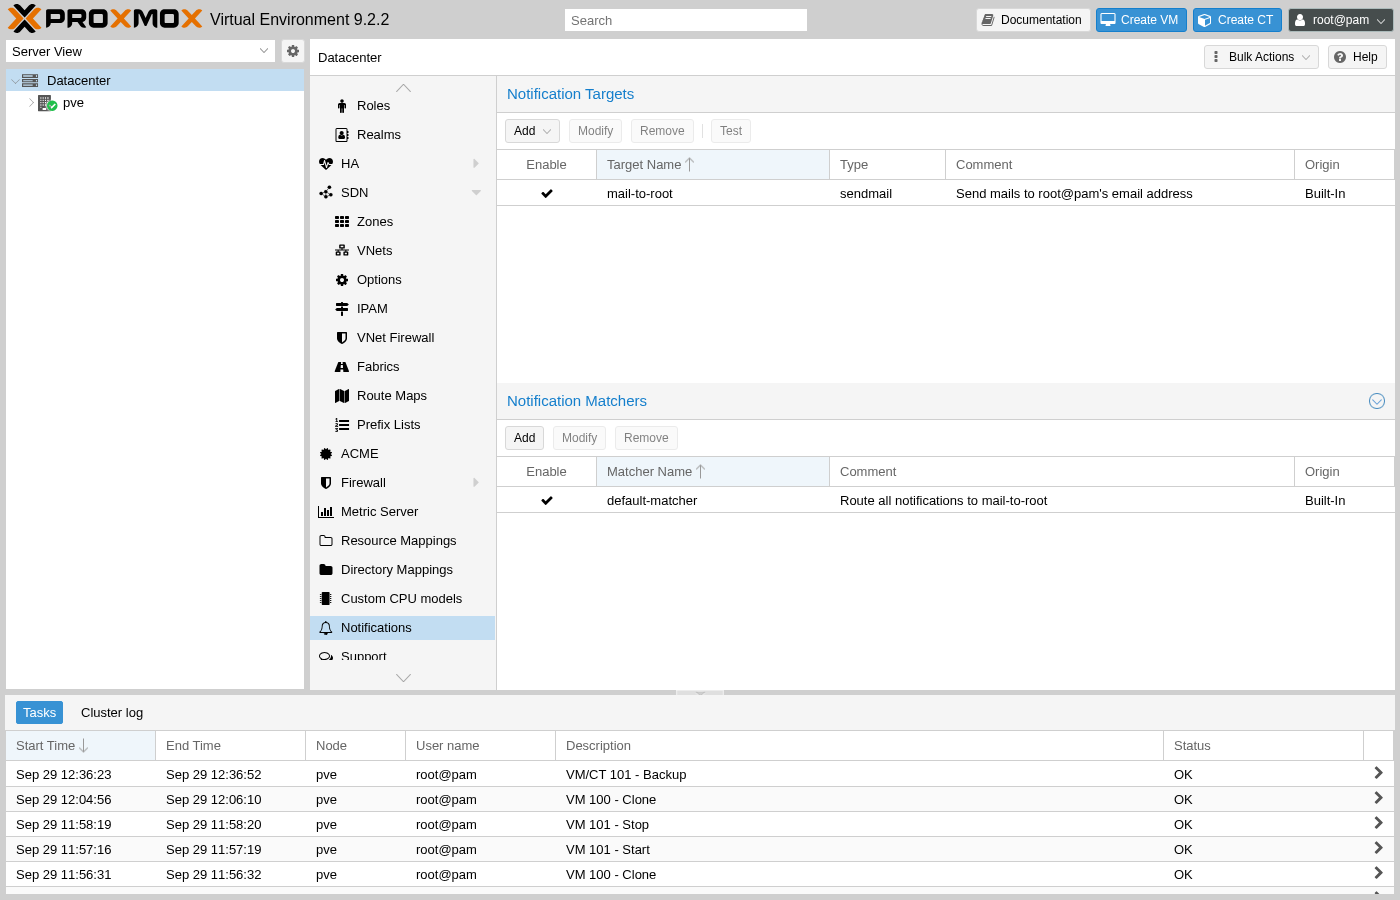
mail-to-root, the target, is a sendmail entry pointed at whatever address root@pam actually resolves to. default-matcher, the matcher, is deliberately unspecific: it matches everything and routes it all to that one target, which is exactly why the vzdump run from the previous guide never needed any notification setup to already have somewhere to report a failure.
Add a Webhook Target
Email works, but it's rarely where an operator actually watches for something to react to in real time. Add, on the Notification Targets toolbar, also offers Gotify, SMTP, and Webhook, and Webhook is the one that reaches anywhere at all: any URL that accepts a POST request, with full control over headers, body, and secrets.
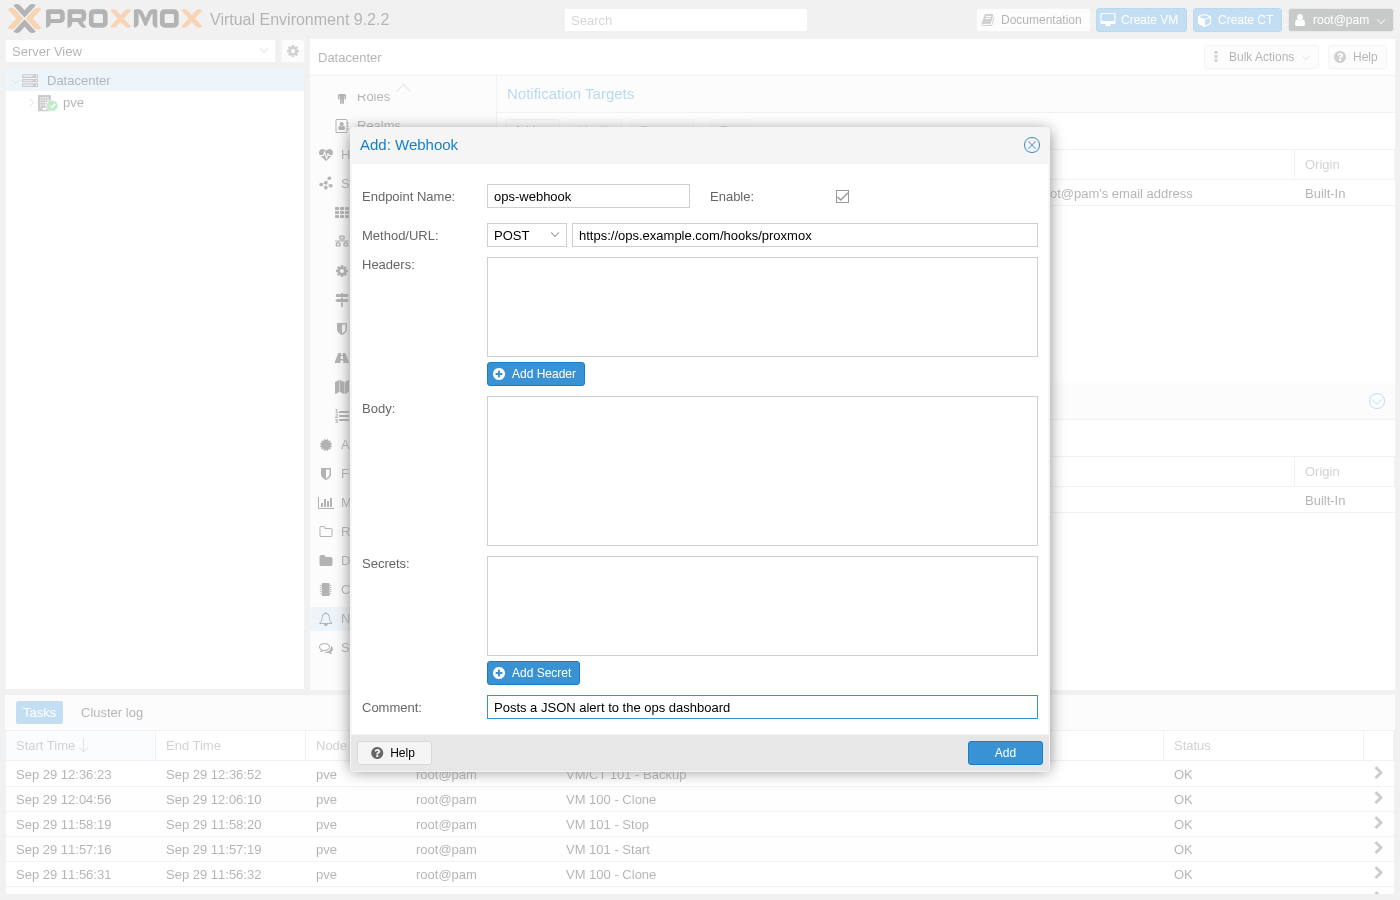
Nothing in that form assumes a specific service on the other end. Headers covers an API key or a content-type override, Body is a free-form template for whatever JSON shape the receiving end expects, and Secrets keeps a token out of the Body field itself so it never shows up in a task log or an audit trail by accident.
Route Specific Events to It
A matcher decides which events actually reach a given target, built from rules that read almost like a search filter. Field, inside a rule, offers exactly five real event types, each one tied to a specific part of Proxmox rather than a made-up severity level:
- vzdump: backup notifications, the exact category a failed job from the previous guide would fall under.
- replication: replication job notifications, relevant the moment a second node joins this cluster.
- fencing: node fencing notifications, tied to HA and worth routing somewhere loud once a real failover setup exists.
- package-updates: a plain heads-up that updates are available, closer to a digest than an incident.
- system-mail: anything else the system would otherwise mail to the local user, a catch-all rather than a specific event.
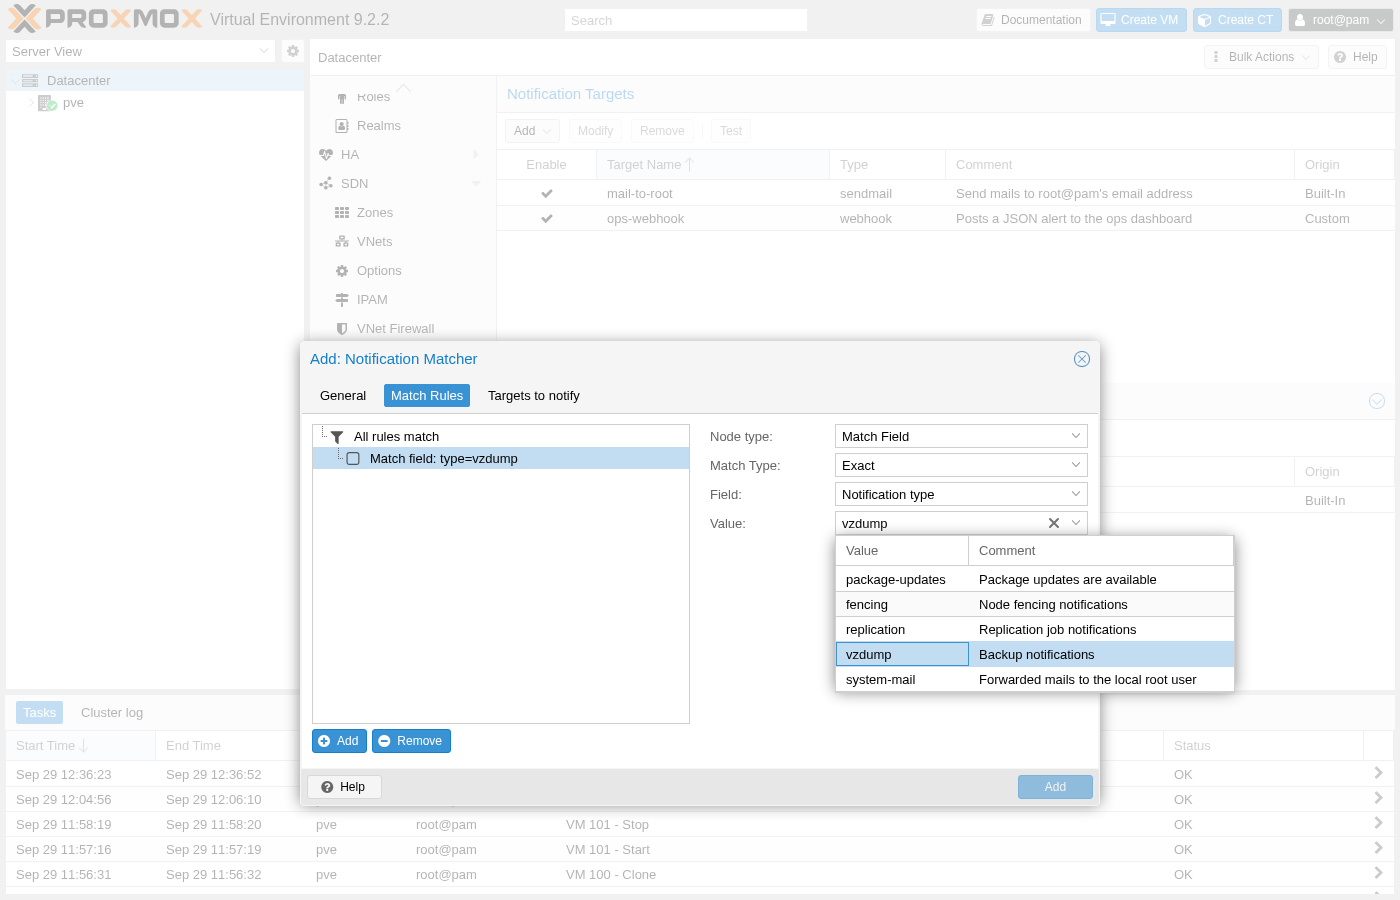
Naming this matcher backup-alerts and checking ops-webhook on its Targets to notify tab, rather than replacing default-matcher outright, means both rules now run side by side: a vzdump event reaches ops-webhook specifically, while default-matcher still catches everything, backup notifications included, and keeps mailing root@pam the same as before. Multiple matchers stacking this way is the normal pattern once alerting grows past a single catch-all rule.
Before relying on a new matcher in production: send a real test event through it first. Test, on the Notification Targets toolbar, fires a genuine notification at a selected target immediately, the fastest way to confirm a webhook endpoint actually receives what this dialog promises before a real backup failure is the first thing to find out.
Export Metrics for Real Dashboards and Alert Thresholds
The built-in graphs answer "what happened," well, for whoever remembers to look. They don't answer "page someone the moment CPU stays above 90% for five minutes," since Proxmox itself has no concept of a metric threshold. That gap is exactly what Metric Server, further up the same Datacenter menu, exists to close: a live stream of every metric this panel already collects, sent out to something built for exactly that job.
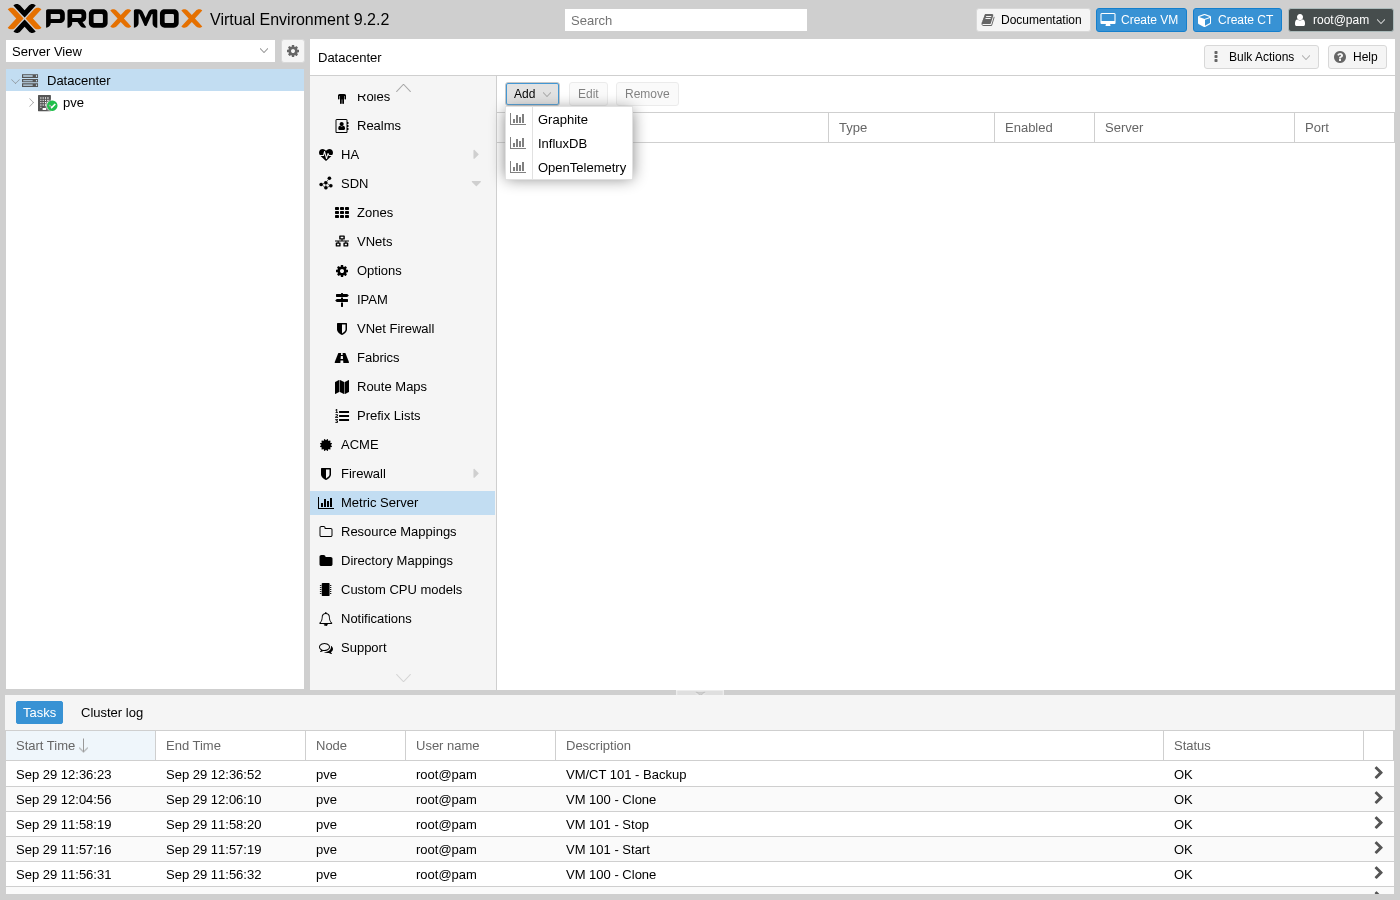
Graphite and InfluxDB are the two long-established options, both long paired with Grafana for exactly this kind of dashboard; OpenTelemetry is the newer, vendor-neutral addition, the same protocol a growing share of observability stacks already standardize on regardless of which database sits behind them.
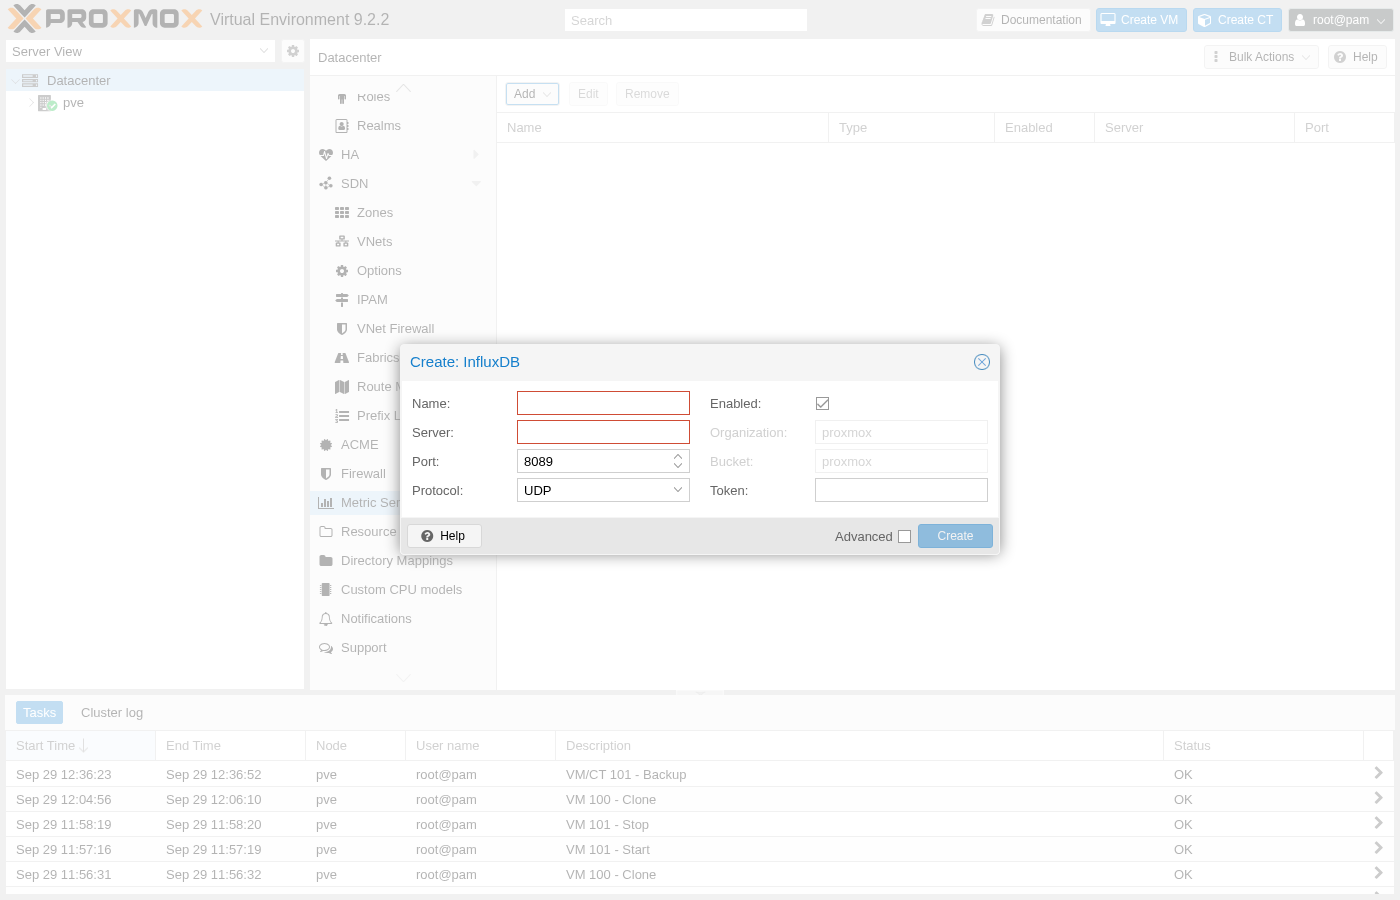
Once metrics land in a real time-series database, threshold alerting stops being a Proxmox limitation at all: Grafana's own alert rules, or anything else that can query InfluxDB or Graphite, take over from there, watching the exact same numbers this guide has been reading by eye on the Summary page all along.
In summary
- Node and Datacenter Summary pages track CPU, memory, network, and disk history for up to a year, no separate tool required for a quick look.
- The notification system splits targets, where an alert goes, from matchers, which events route there, and both can stack.
- A webhook target reaches any URL at all, the same integration point behind Slack, Discord, PagerDuty, or an in-house dashboard.
- Metric Server export to Graphite, InfluxDB, or OpenTelemetry is what actually enables threshold-based alerting past what Proxmox tracks natively.
The traffic riding on the tunnel from earlier in this guide has its own usage worth watching too, covered in Taipan's own bandwidth measurement reference.